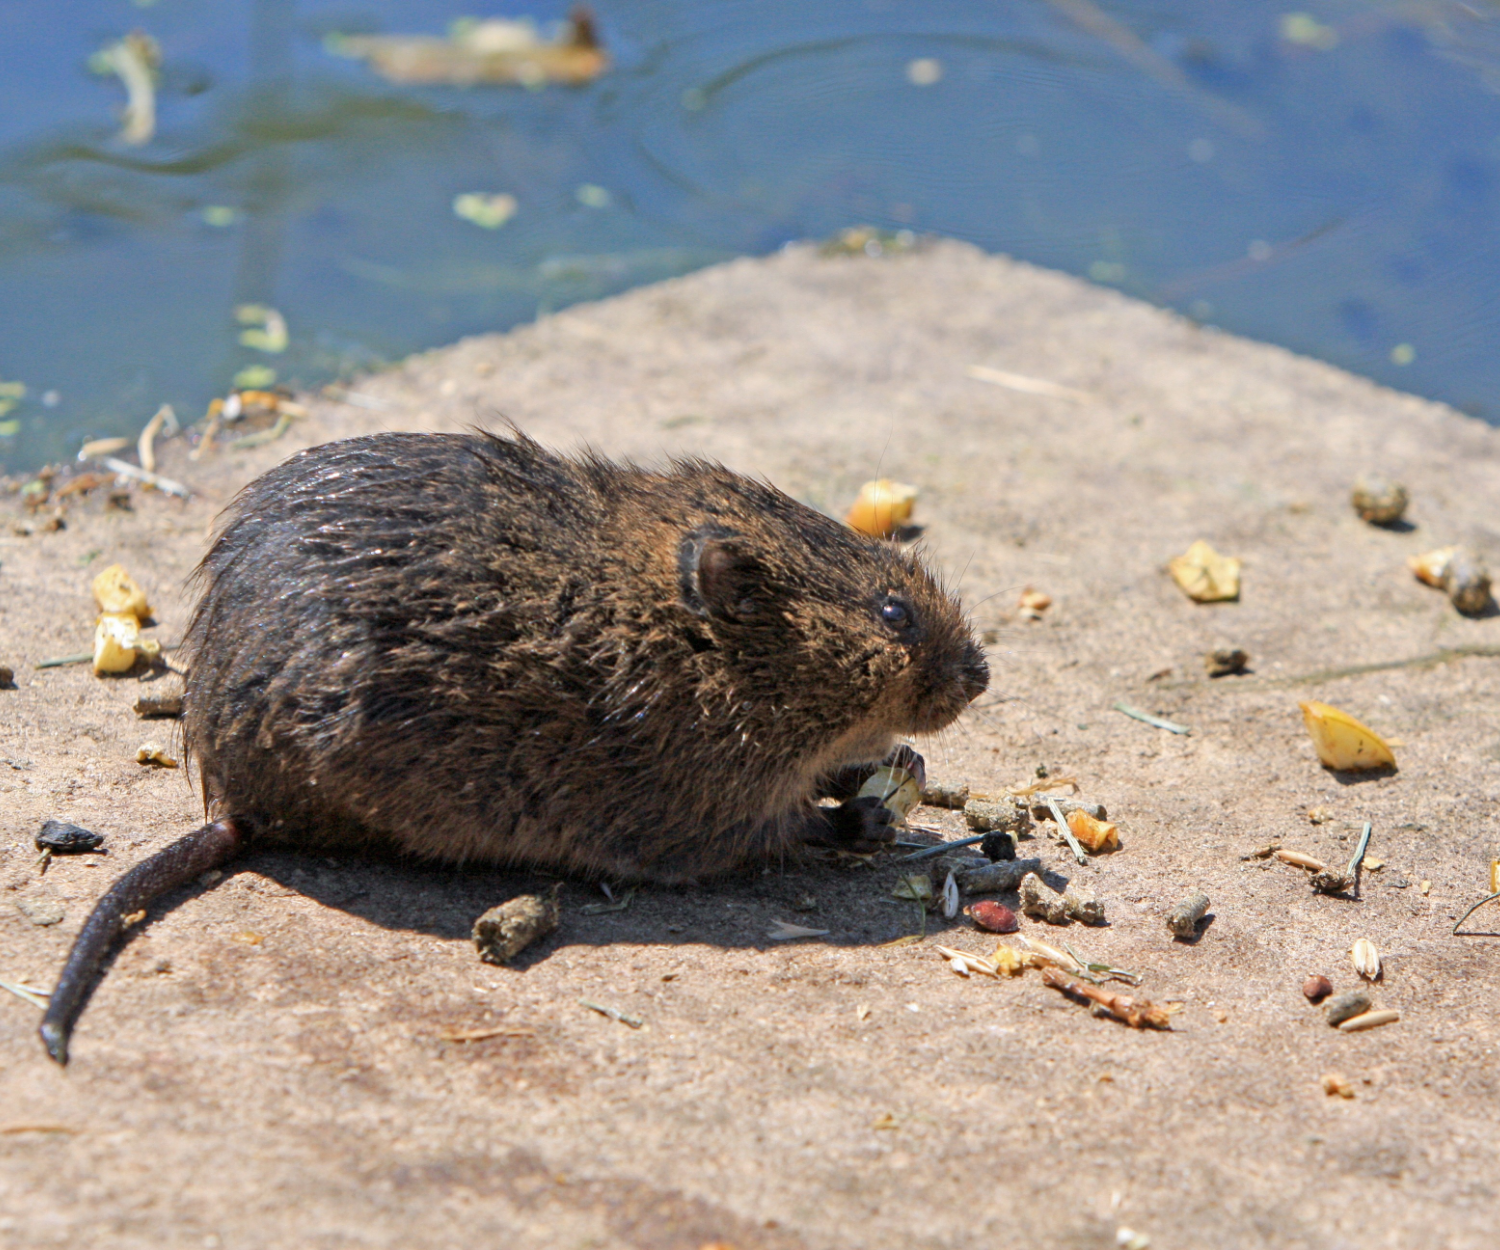
The Rodent Inspection Journey in NYC
Project Summary
This project is my very first data science project which was a group effort during my first semester in University of Malaya. Using R language is the main programming language, we obtained the NYC Rodent Inspection logs data which is a medium-sized dataset and started the project from data cleaning to descriptive analysis which involved EDA. As per the requirements given by our lecturer, the main objectives of this project were as follows:
- To perform exploratory analysis on the cleaned dataset and extract valuable insights from the data.
- To create a data-driven product in the form of web application that uses descriptive analytics to tell stories and help users solve problems.
Results
A total of 3 different sets of outputs were derived from the cleaned data which consisted of a location-based tracker that tracks the rodent inspection progress from different areas in New York city, a static map that highlights the top regions based on the results of inspections, and a graph-based dashboard that outputs the breakdown of inspection results by different boroughs. These outputs were combined to form the prototype data product.
Shiny Apps Deployment
After several amendments and improvements based on our team’s internal feedbacks, the final data product was developed as a web application. This app is a highly comprehensive app that has the capability of aiding users to track any areas and view the severity of rodent issues within NYC, not to mention that it has an interactive map! A user guide was also included to help users familiarise with the web app. Finally, the app was deployed smoothly using RStudio’s built-in R Shiny Apps framework that has its own server. With this, anyone with the link is free to explore the simple yet user-friendly web app anytime.
Deployed web app: R Shiny Apps
Dataset source: NYC open data link
